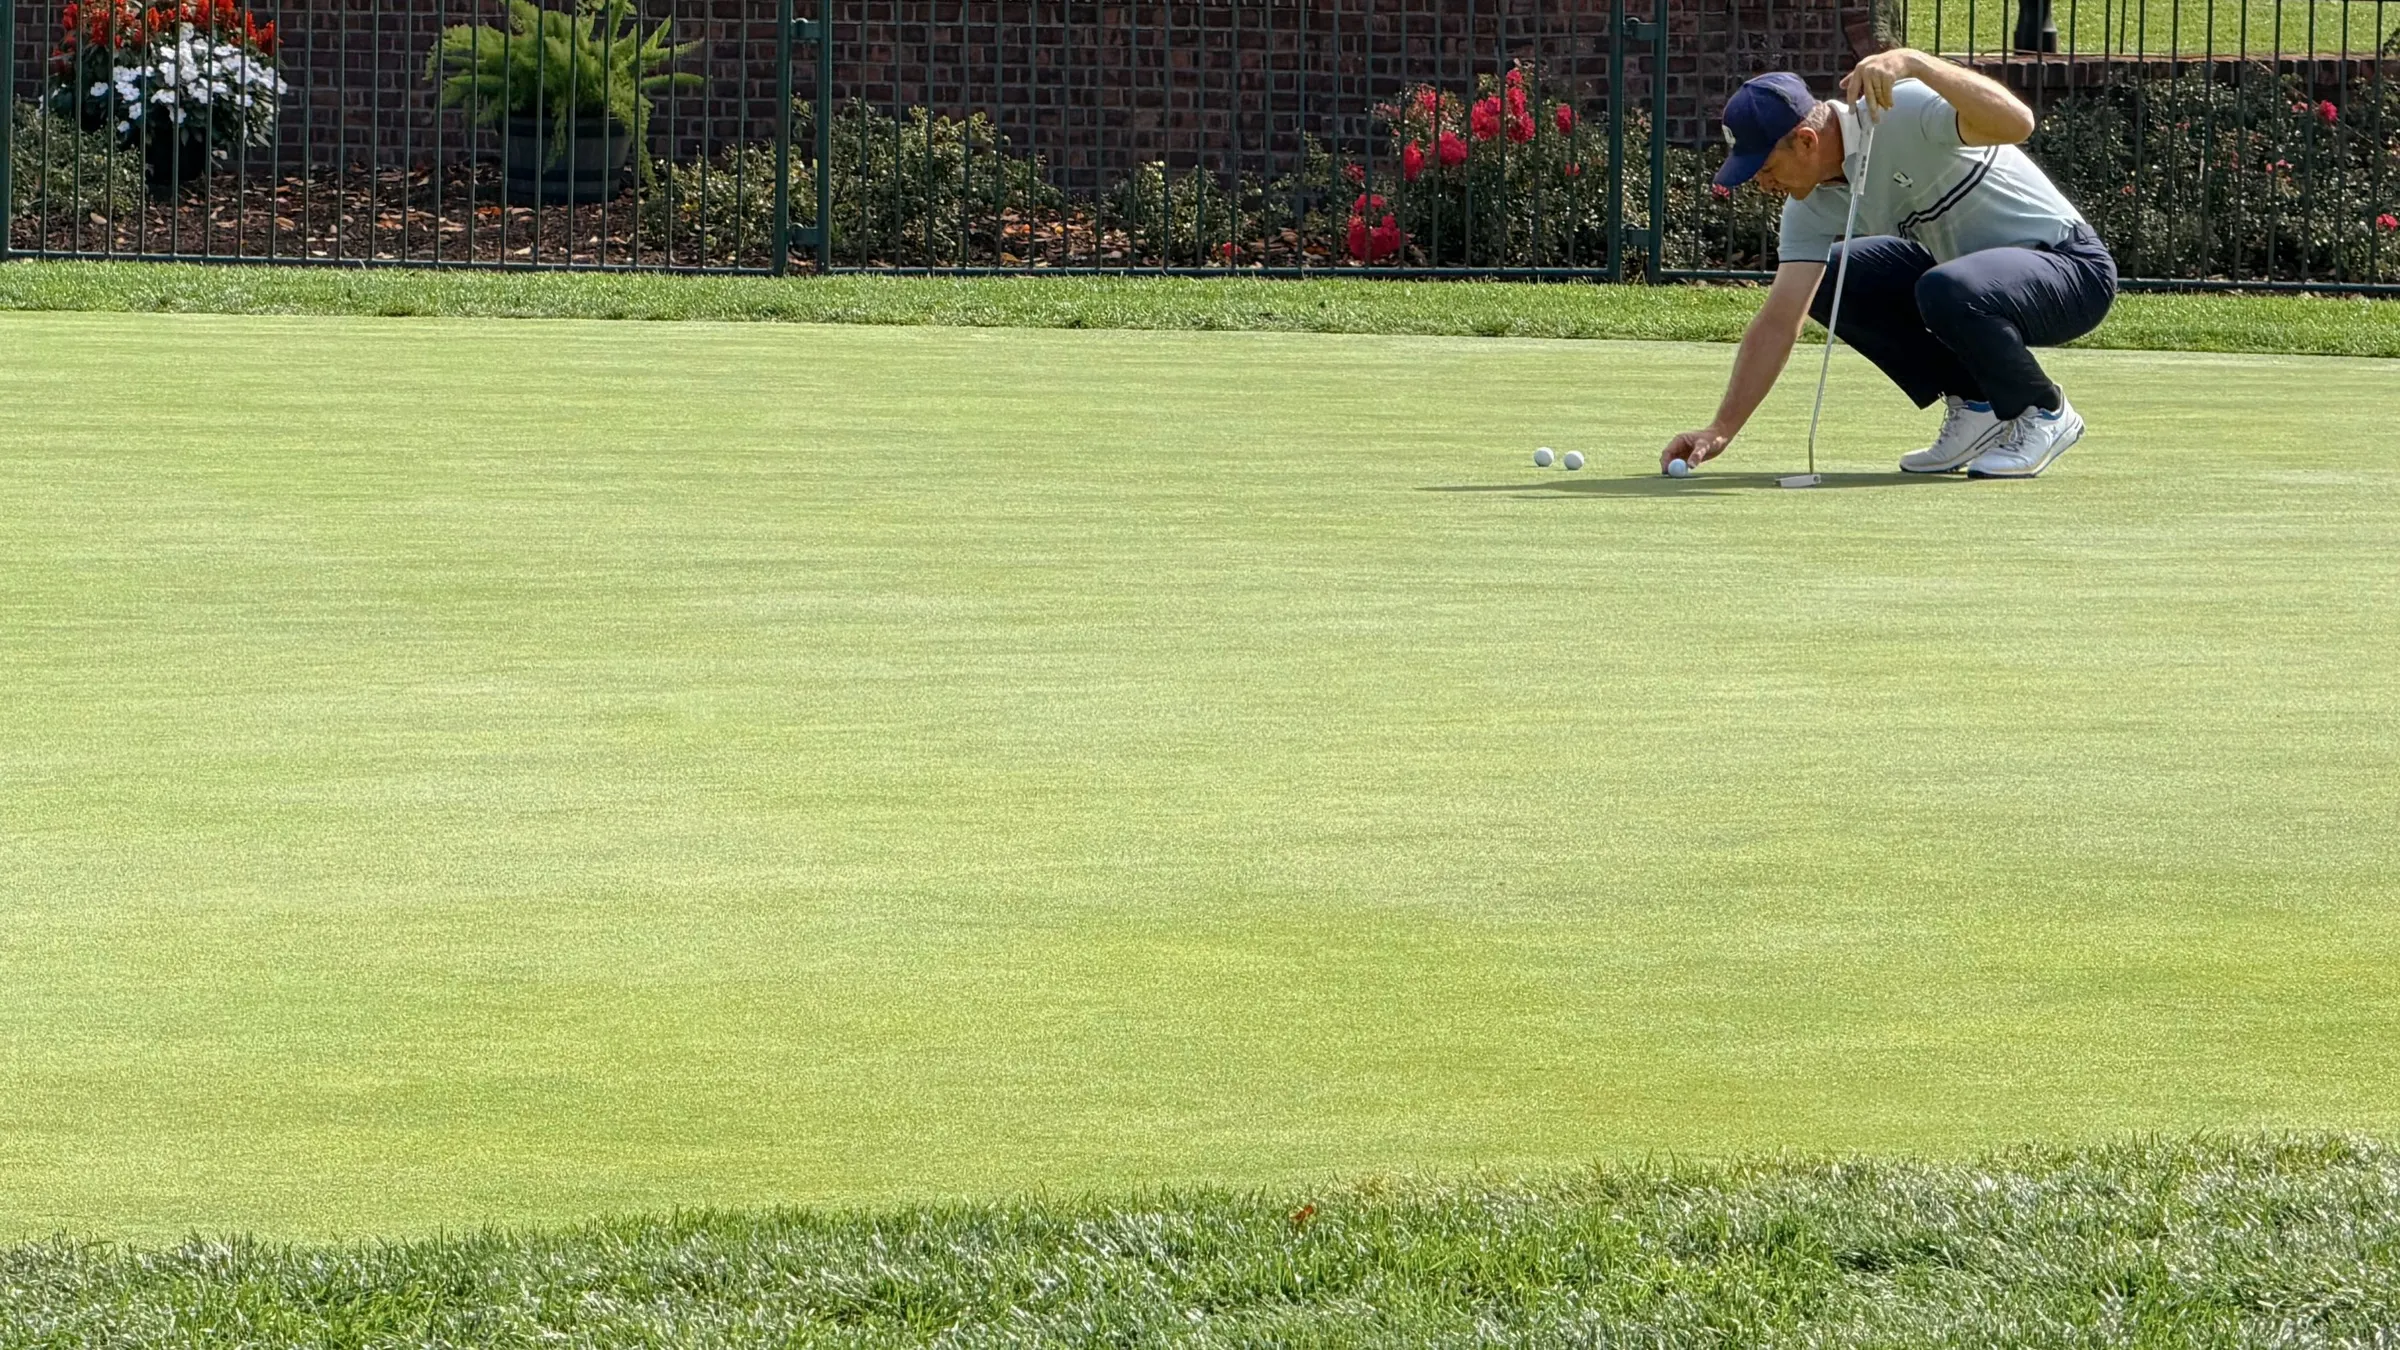
It’s one of the most frustrating feelings in golf. You hit a great tee shot down the center of the fairway. You follow it up with a decent approach to find the green in regulation, but you walk away with a bogey due to a three-putt.
When looking back after the round, it’s often the three-putts that you wish you had back. They feel like low-hanging fruit to avoid. Something that shouldn’t happen if you’re putting well, at least not often.
But three-putts are part of the game. They happen, even to professional golfers, especially as the length of putt increases past 30 feet. According to Mark Broadie’s seminal book, Every Shot Counts, a PGA TOUR pro has almost a one in four chance of three-putting from 60 feet.
So before you beat yourself up too much over your next three-putt, it helps to put into context how often they occur at the highest level of the game.
How Often Do PGA TOUR Pros Three-Putt?
Using the historical data tracked by the PGA TOUR, I charted the three-putt rates across 35 seasons, from 1992-2026. For 2026, I used the statistics through the TOUR Championship, the conclusion of the FedExCup season. I tracked the TOUR average for each year, along with the No. 50 ranked player and No. 1 ranked player to understand the depth of performance as well.
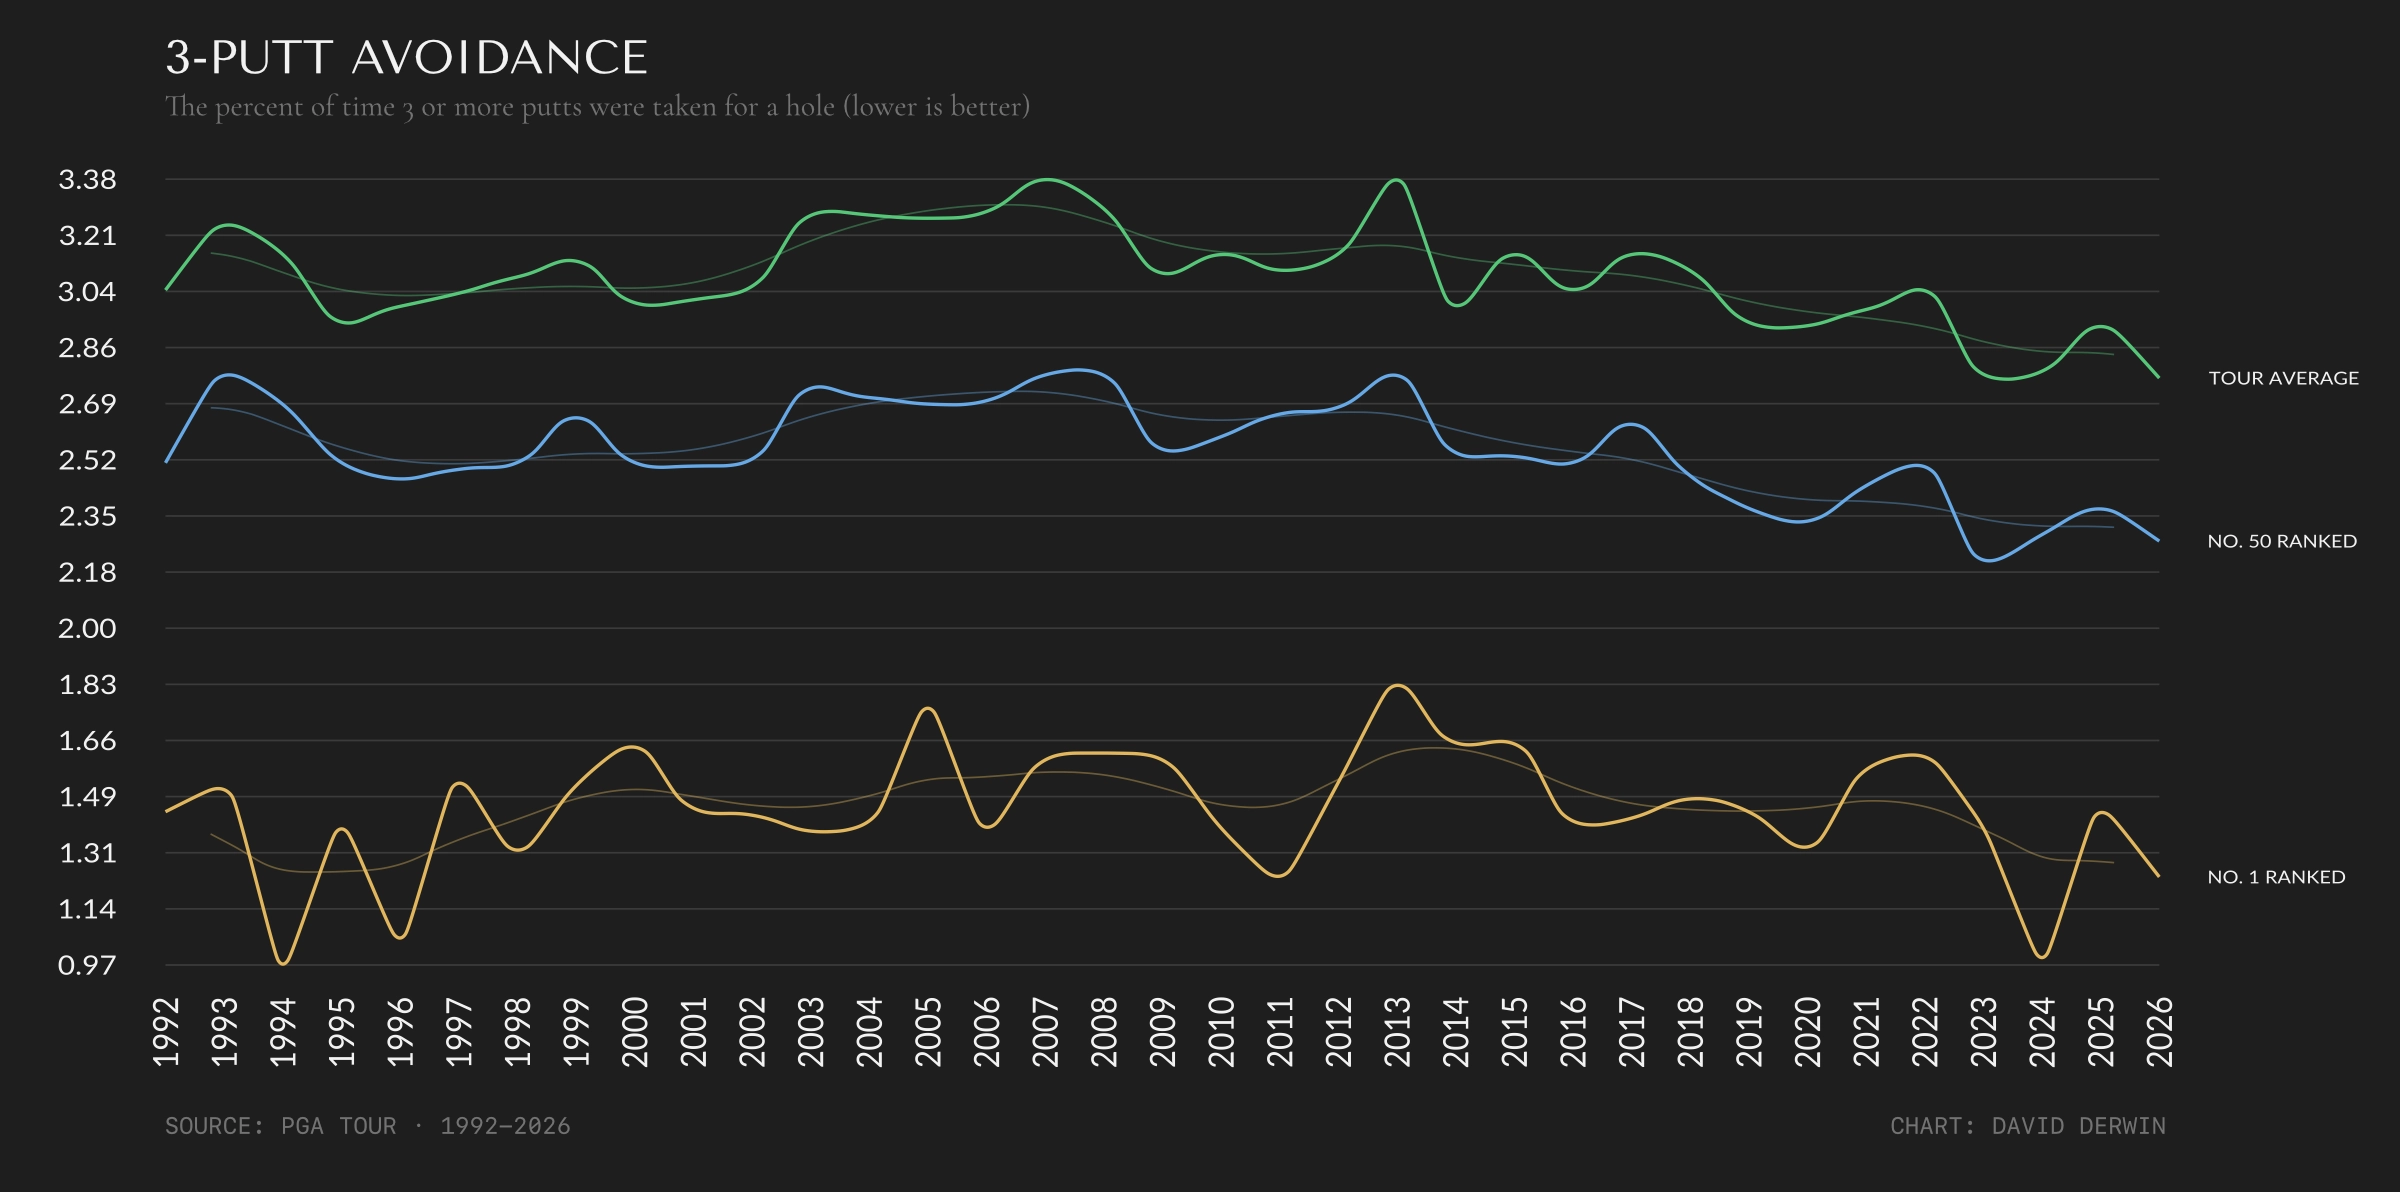
Between 1992 and 2026, the single-season PGA TOUR average for three-putt percentage ranged between 2.77 and 3.38%.
Taking the average of each season’s TOUR average gives us a historical average three-putt rate of 3.08%.
Let’s call it 3%.
A 3% three-putt rate equates to roughly one three-putt every 33 holes, or about once every two rounds. Over a 72-hole tournament, the historically average PGA TOUR player can expect a little more than two three-putts.
We can derive a historically average three-putt percentage for the middle and top of the field as well by averaging each season’s No. 50 and No. 1 ranked player in the statistic.
The No. 50 ranked player averaged a three-putt rate of 2.55%, roughly one three-putt every 39 holes, or a little less than once every two rounds. Over a 72-hole tournament, that works out to about 1.8 three-putts, about 0.38 fewer three-putts over four rounds compared to the historical tour average.
The No. 1 ranked player averaged less than half of the average TOUR player, three-putting just 1.45% of the time. That works out to roughly one three-putt every 69 holes, or almost exactly one three-putt over a 72-hole tournament.
The difference between a No. 1 ranked player in three-putt avoidance and the TOUR average works out to about 1.17 fewer three-putts over 72 holes.
Are Players Better at Three-Putt Avoidance Today?
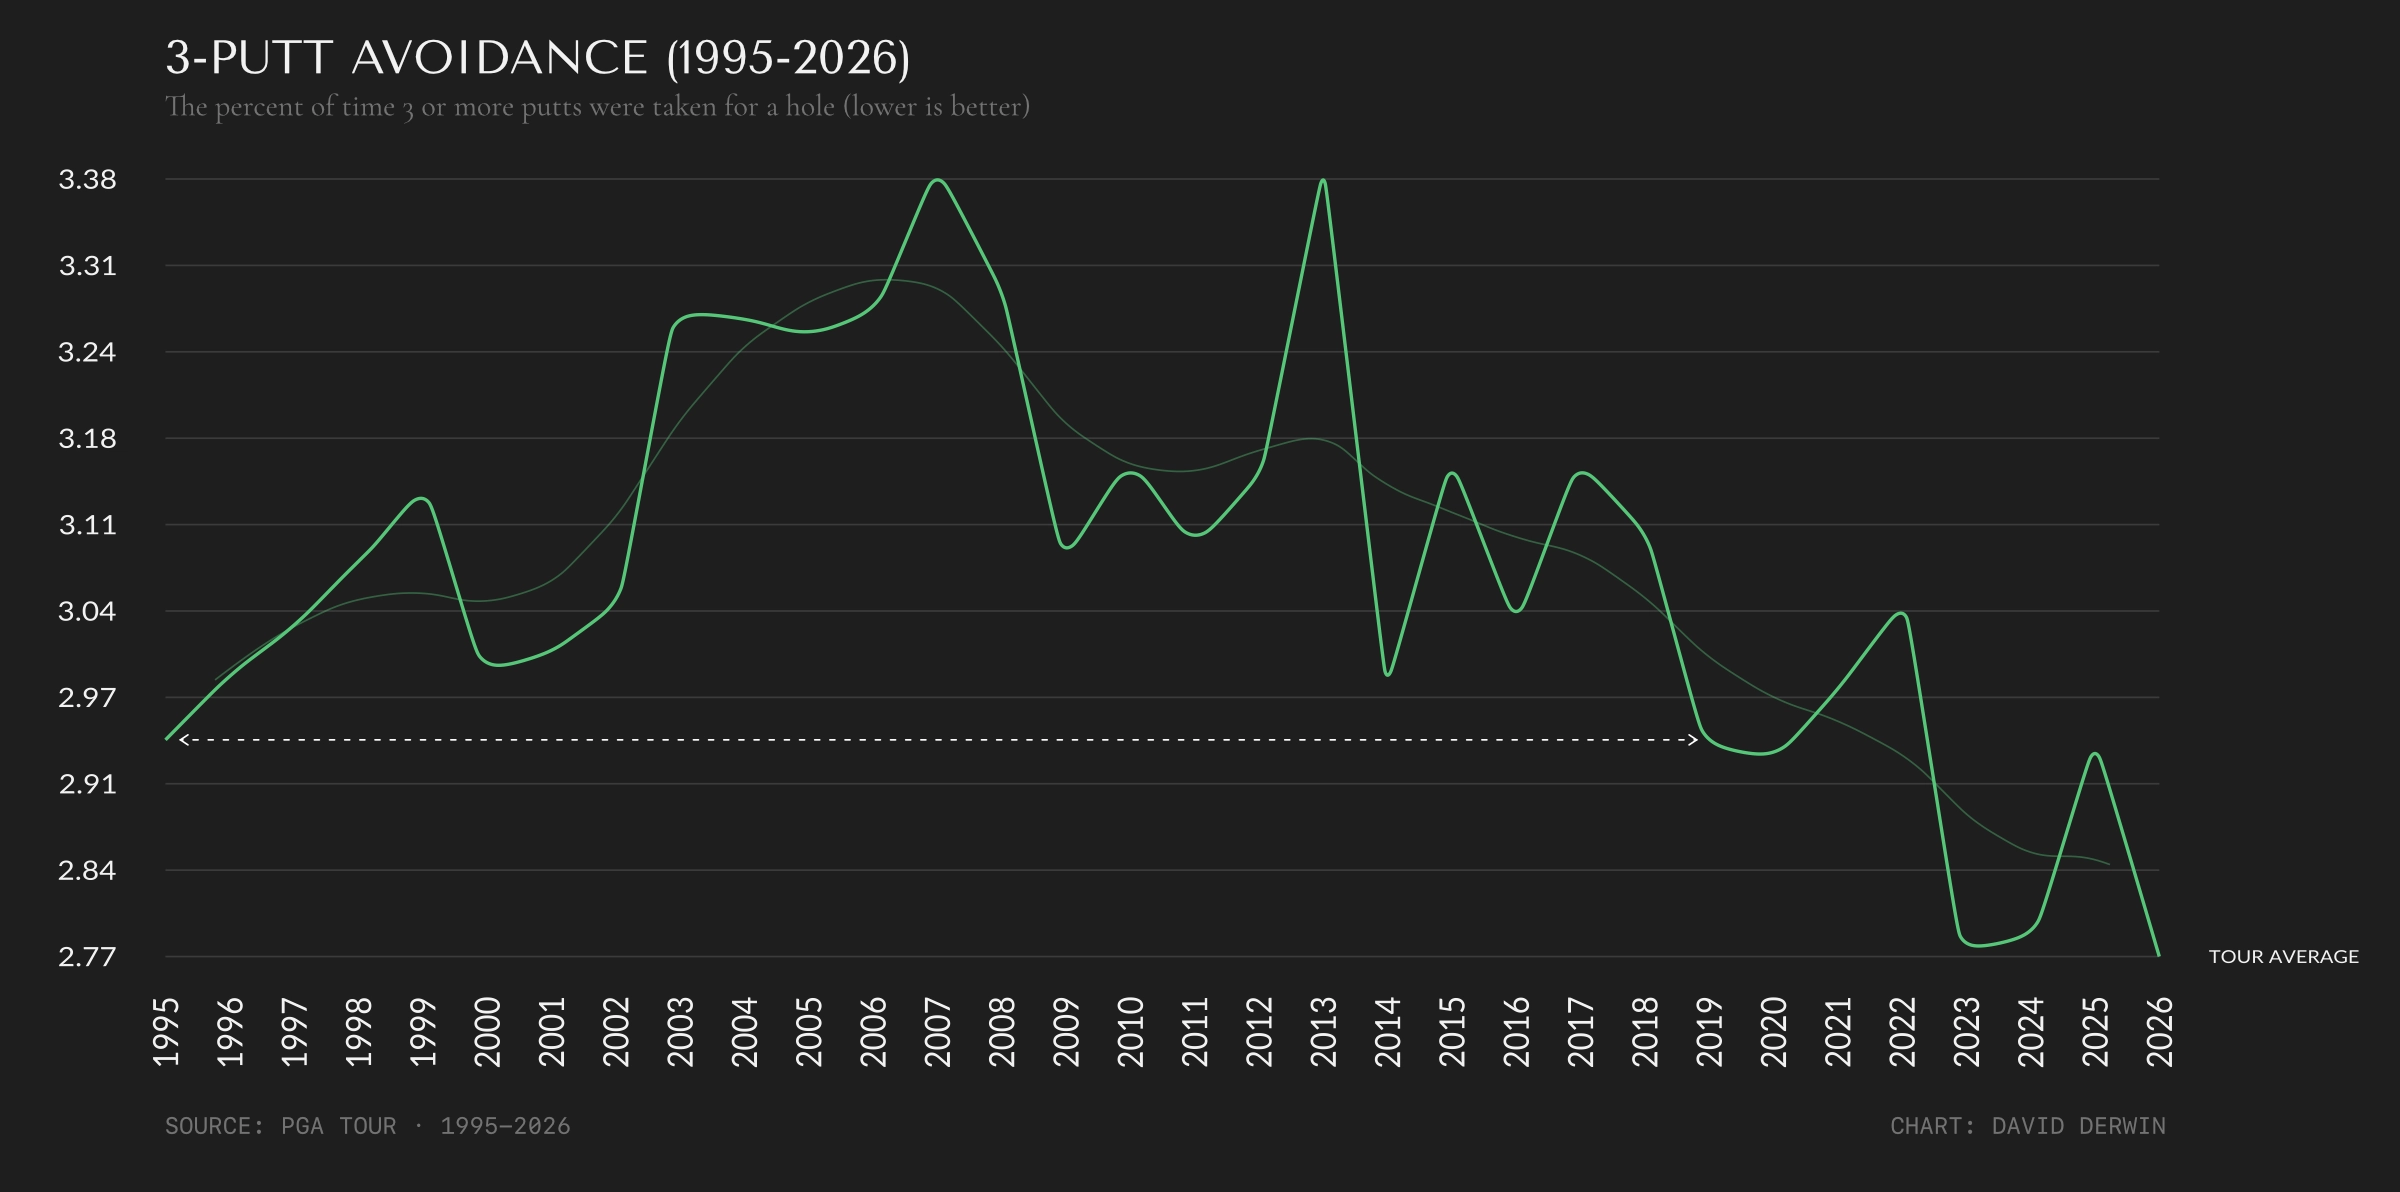
The 2026 season produced the lowest TOUR average three-putt rate in the dataset at 2.77%. Four of the five lowest three-putt rates have occurred in the past four seasons, and the TOUR average has remained between 2.77% and 3.04% every year since 2019.
The difference between the historical average of 3% and present-day average of 2.77% may not sound significant, but it represents a 7.7% reduction in three-putt frequency. The historical average works out to roughly one three-putt every 33 holes. At the 2026 TOUR average, that stretches to once every 36 holes. Over 72 holes, that’s about 0.17 fewer three-putts, or roughly one avoided three-putt every six tournaments. Over an 80-round season, it works out to more than three fewer three-putts.
The modern TOUR player is three-putting less often than prior generations of players, but the progression to today was not linear.
After the PGA TOUR began tracking three-putt avoidance in 1992, the TOUR average reached an early low of 2.94% in 1995. From there, three-putt rates generally trended higher, eventually reaching a dataset-high TOUR average of 3.38% in 2007.
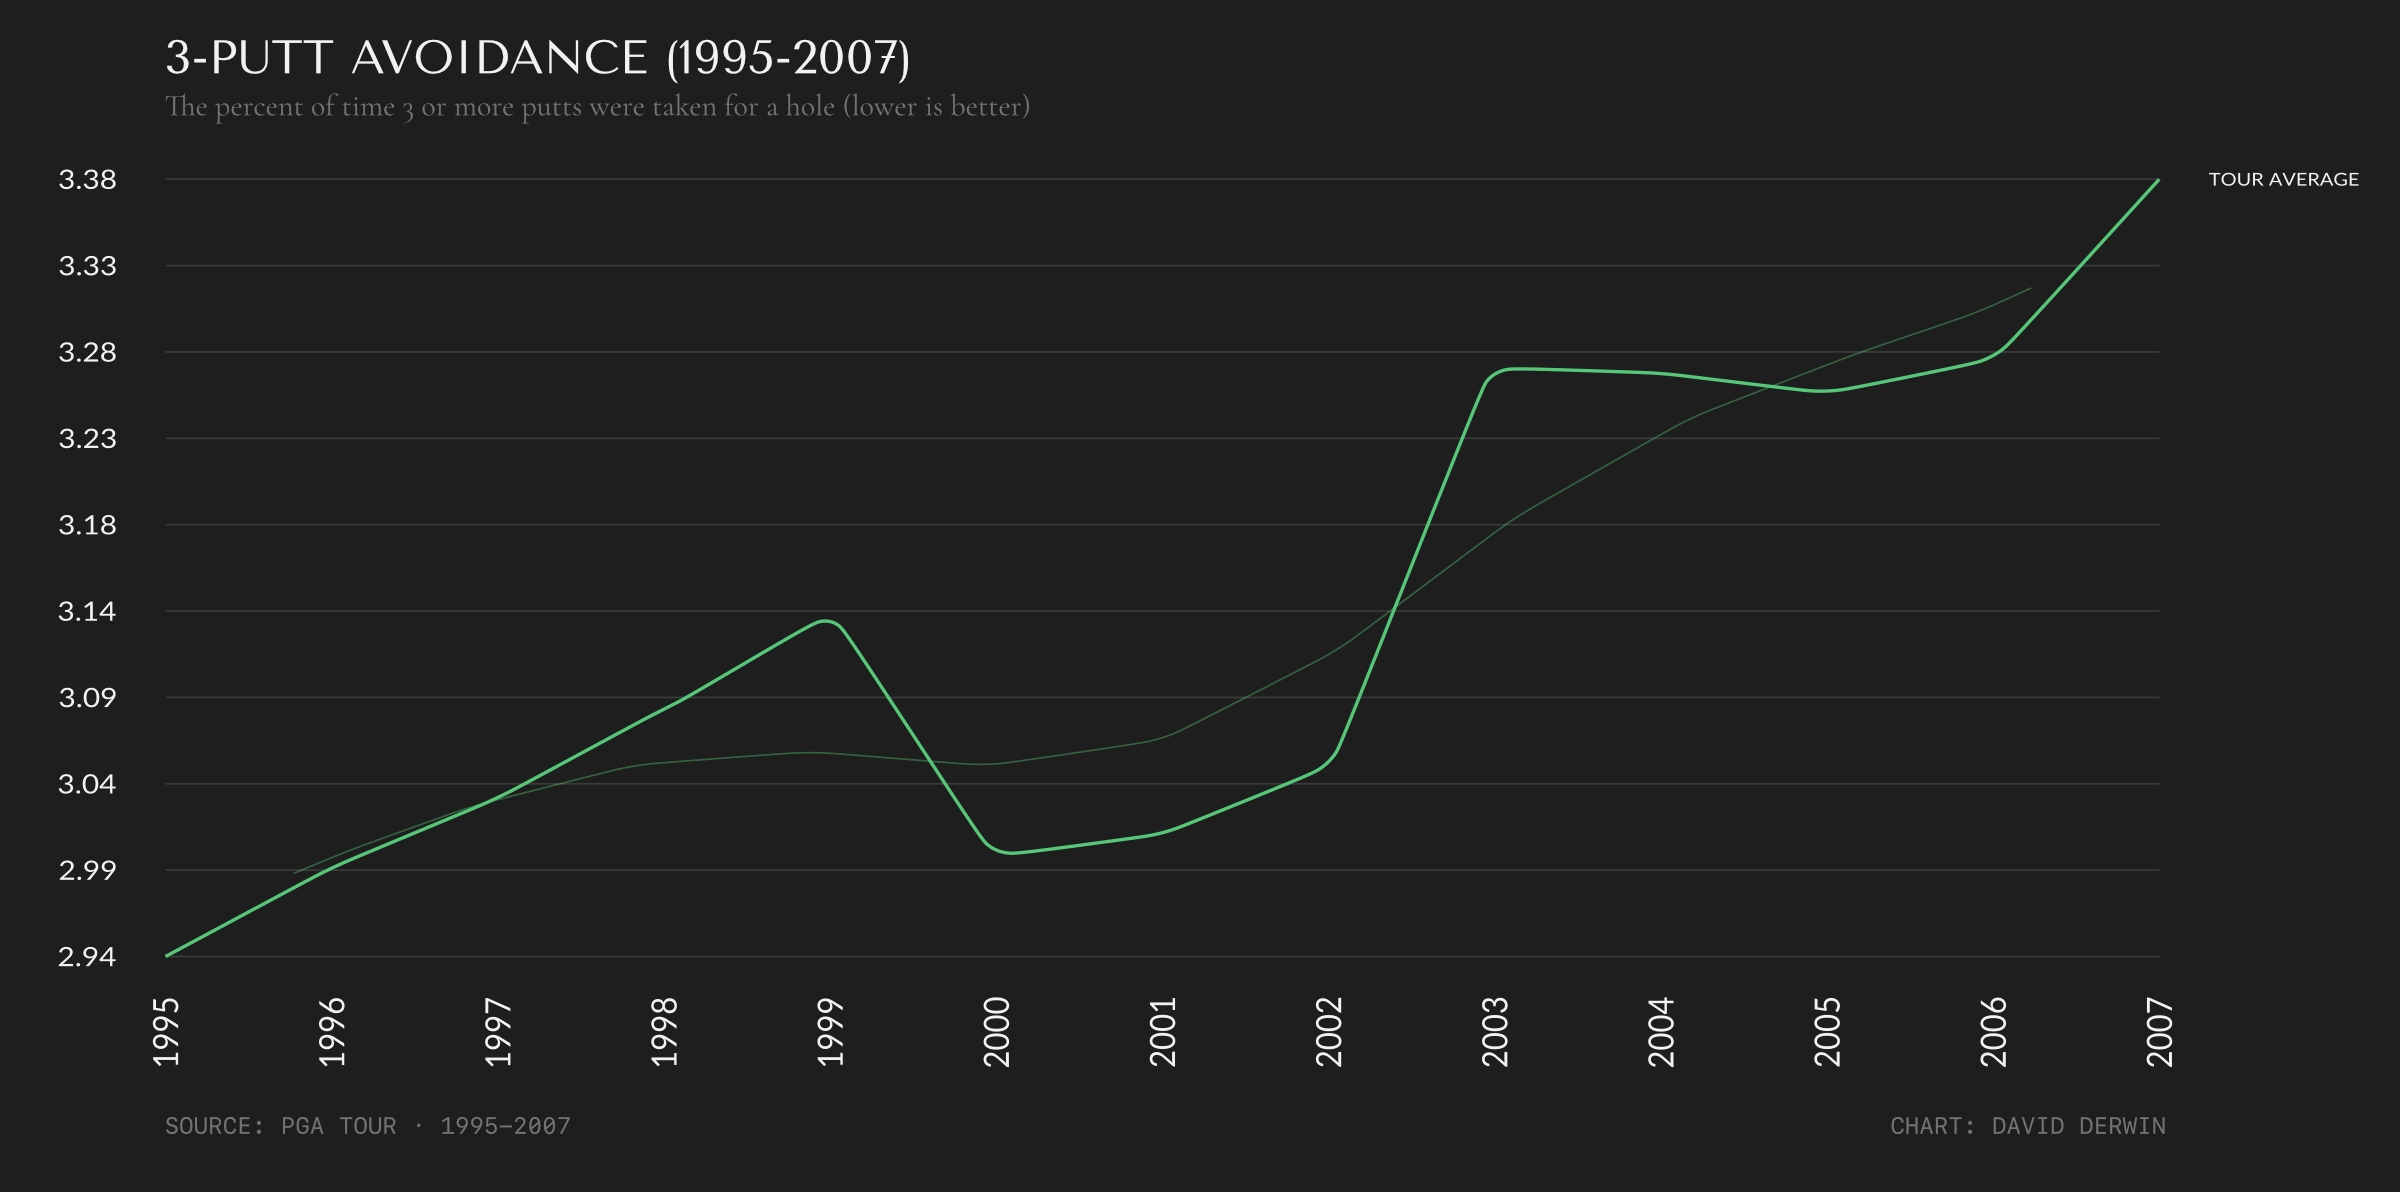
It wasn’t until 2019, 24 years after that 1995 low, that the TOUR average returned to 2.94%. Since then, it has continued to trend lower, culminating in the 2.77% rate in 2026.
In other words, a PGA TOUR player in 1995 was putting with essentially the same average three-putt rate as a player in 2019. That’s surprising considering the advances in putter design, green reading methodologies, and technology used to better understand ball roll characteristics that have taken place during that same timeframe.
But those advancements didn’t happen in isolation. While players were gaining more advanced tools and systems to better understand putting, the conditions they were putting under were changing, too.
Green Speeds Increased
In a 2023 GOLF.com article, Pinehurst No. 2 superintendent John Jeffreys estimated that average putting surfaces were running about two feet faster than when he entered the industry nearly 30 years earlier.
Faster green speeds make three-putts more difficult to avoid. Errors in pace on lag putts are amplified, particularly when putting downhill. A lag putt hit too hard will continue to roll farther past the hole, leaving a longer putt coming back. And while green speed alone doesn’t explain a TOUR-wide statistic in three-putt avoidance, it provides context to the increasingly demanding putting surfaces players were encountering between the 1990s and early aughts.
Look no further than Pinehurst No. 2 itself as an example.
When Payne Stewart won the 1999 U.S. Open, the greens at Pinehurst No. 2 were running at 10.5 on the Stimpmeter. Compare that to the 2024 playing of the U.S. Open, again at Pinehurst No. 2, where superintendents targeted green speeds of 13.5.
Today, Pinehurst maintains green speeds of 11 for everyday resort play, faster than its greens were when Payne Stewart sank a 15-footer on the 72nd hole to win the 1999 U.S. Open, which he celebrated with the now-iconic pose of his right fist extended and right leg kicked back.
The good news for players is that green speeds can’t increase indefinitely. There is a limit to how fast putting surfaces can get before they become unplayable. That limit was tested at the 2007 U.S. Open at Oakmont, where the greens reached a blistering 14.5-15 on the Stimpmeter during Friday’s second round play. It also happened to be the same year the PGA TOUR average three-putt rate reached its historical high.
U.S. Open setups are notoriously difficult, and week-to-week play doesn’t occur on such fast greens. But putting surfaces have generally gotten faster since the 1990s.
There is an argument to be made that three-putt rates ticked up during the period the PGA TOUR was pushing the limits of green speeds. But green speeds couldn’t continue increasing indefinitely, and as those conditions became established, the technology and research available to help players adapt was advancing as well.
Putting Got More Scientific
Applying science to putting isn’t new. Dave Pelz was one of the early pioneers of using research and measurement to better understand the putting stroke and short game.
But the amount of information available to a PGA TOUR player today looks considerably different than it did in the 1990s.
Spend time around a PGA TOUR practice green today and it isn’t unusual to see a player, caddie or putting coach using a level to measure the slope of the green. Rather than relying solely on what a putt looks like, players can assign a number to the slope and use that information to better understand how much a putt will break.
AimPoint is perhaps the most visible example. Developed by Mark Sweeney in the early 2000s, the popular green-reading system uses the percentage of slope of the putting surface to establish a visual aim point for the putt. Scott McCarron became an early adopter on the PGA TOUR in 2005, and the technique has steadily grown in popularity ever since. Today, AimPoint estimates half of the current world top 20 men and women players use the technique, including Sam Burns who is one of the best putters on the planet.
The putting stroke itself has become increasingly measurable as well.
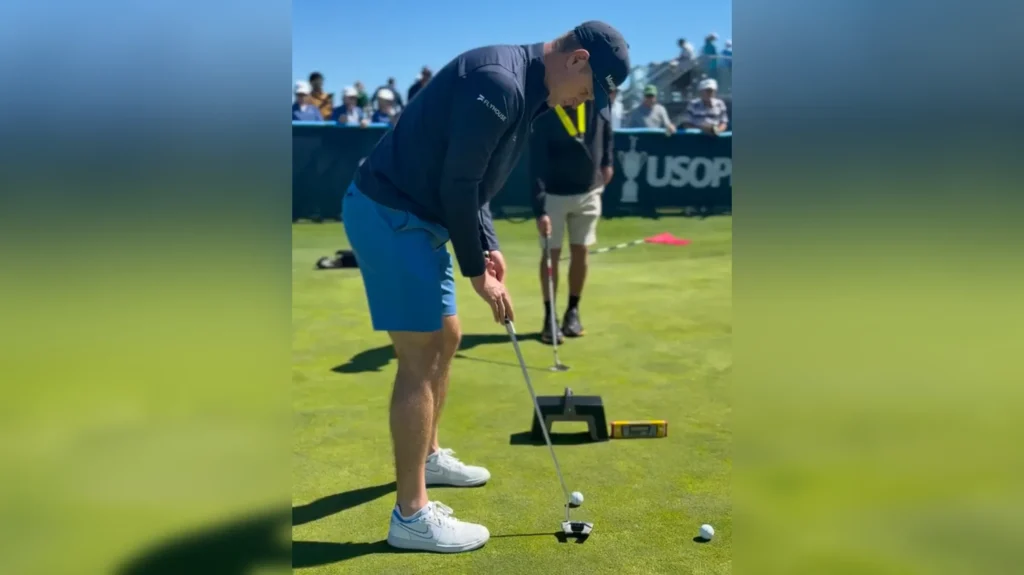
Systems like SAM PuttLab can measure what the putter is doing throughout the stroke, while high-speed camera systems like Quintic can measure what happens to the golf ball immediately after impact. Earlier this year, Ben Griffin and Justin Rose were spotted using a Smart Putting Gate in practice. Developed by Grasp Technology, the SPG is a first of its kind design where ball speed, line and impact location are measured by putting a ball through the device.
Face angle, path, impact location, launch, tempo and roll are no longer things a player and coach have to diagnose solely by eye. This data isn’t exclusive to professionals either. Many of these data points can be measured by consumer-priced products like Blast Motion and Vertex putting sensors.
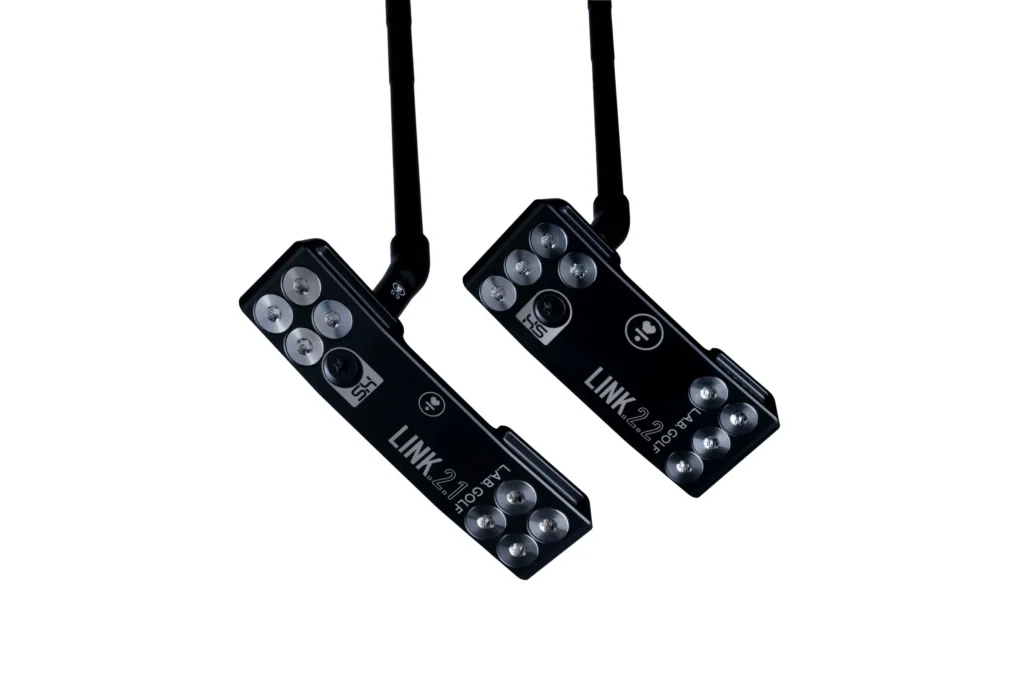
Putters have become more forgiving, too. Over the past several years, players have migrated heavily to higher-MOI mallet designs that reduce the amount of ball speed lost on off-center strikes. That’s particularly relevant to three-putting. On a long first putt, an off-center strike that loses less ball speed will travel closer to the intended distance than a putter with less off-center forgiveness like a blade.
None of these advancements can be isolated as the reason three-putt rates began falling after 2007. The data alone doesn’t tell us that. But as faster greens became an established part of the modern game, players gained increasingly sophisticated ways to read those greens, measure their putting strokes, understand how the ball was rolling and reduce the consequences of a mishit.
The data does tell us that players are better than ever at avoiding three-putts today.
How Low Can You Go?
Only two players have recorded PGA TOUR seasons with a three-putt rate below 1%, and they happened exactly 30 years apart.
In 2024, Russell Henley recorded only 13 three-putts over 1,314 holes—a three-putt rate of 0.99%.
The lowest three-putt rate in the PGA TOUR dataset was recorded by Greg Norman. For the 1994 PGA TOUR season, Norman had just 11 three-putts over 1,134 holes for a three-putt rate of 0.97%.
That equates to just one three-putt every 5.7 rounds of golf.
Perhaps fittingly, the two sub-1% seasons bookend much of the change that took place in between. Norman set the mark in 1994, before the three-putt rate began its rise toward the 2007 peak. Henley nearly matched it 30 years later on generally faster putting surfaces, after many of the tools and technologies used by modern players had become available and more widely adopted.